Assessing Cardiovascular Risk Factors with Computer Vision
February 19, 2018
Posted by Lily Peng MD PhD, Product Manager, Google Brain Team
Quick links
Heart attacks, strokes and other cardiovascular (CV) diseases continue to be among the top public health issues. Assessing this risk is critical first step toward reducing the likelihood that a patient suffers a CV event in the future. To do this assessment, doctors take into account a variety of risk factors — some genetic (like age and sex), some with lifestyle components (like smoking and blood pressure). While most of these factors can be obtained by simply asking the patient, others factors, like cholesterol, require a blood draw. Doctors also take into account whether or not a patient has another disease, such as diabetes, which is associated with significantly increased risk of CV events.
Recently, we’ve seen many examples [1–4] of how deep learning techniques can help to increase the accuracy of diagnoses for medical imaging, especially for diabetic eye disease. In “Prediction of Cardiovascular Risk Factors from Retinal Fundus Photographs via Deep Learning,” published in Nature Biomedical Engineering, we show that in addition to detecting eye disease, images of the eye can very accurately predict other indicators of CV health. This discovery is particularly exciting because it suggests we might discover even more ways to diagnose health issues from retinal images.
Using deep learning algorithms trained on data from 284,335 patients, we were able to predict CV risk factors from retinal images with surprisingly high accuracy for patients from two independent datasets of 12,026 and 999 patients. For example, our algorithm could distinguish the retinal images of a smoker from that of a non-smoker 71% of the time. In addition, while doctors can typically distinguish between the retinal images of patients with severe high blood pressure and normal patients, our algorithm could go further to predict the systolic blood pressure within 11 mmHg on average for patients overall, including those with and without high blood pressure.
 |
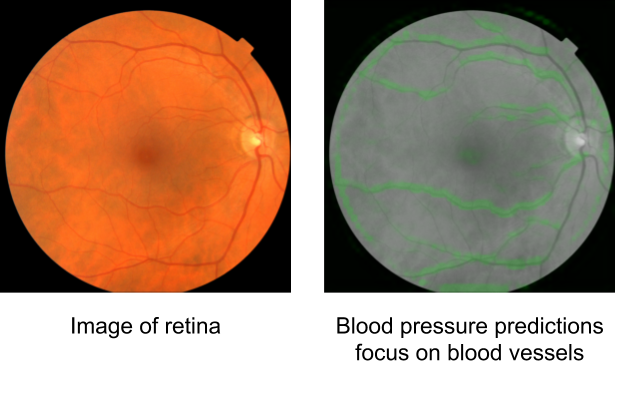
| LEFT: image of the back of the eye showing the macula (dark spot in the middle), optic disc (bright spot at the right), and blood vessels (dark red lines arcing out from the bright spot on the right). RIGHT: retinal image in gray, with the pixels used by the deep learning algorithm to make predictions about the blood pressure highlighted in shades of green (heatmap). We found that each CV risk factor prediction uses a distinct pattern, such as blood vessels for blood pressure, and optic disc for other predictions. |
More importantly, we opened the “black box” by using attention techniques to look at how the algorithm was making its prediction. These techniques allow us to generate a heatmap that shows which pixels were the most important for a predicting a specific CV risk factor. For example, the algorithm paid more attention to blood vessels for making predictions about blood pressure, as shown in the image above. Explaining how the algorithm is making its prediction gives doctor more confidence in the algorithm itself. In addition, this technique could help generate hypotheses for future scientific investigations into CV risk and the retina.
At the broadest level, we are excited about this work because it may represent a new method of scientific discovery. Traditionally, medical discoveries are often made through a sophisticated form of guess and test — making hypotheses from observations and then designing and running experiments to test the hypotheses. However, with medical images, observing and quantifying associations can be difficult because of the wide variety of features, patterns, colors, values and shapes that are present in real images. Our approach uses deep learning to draw connections between changes in the human anatomy and disease, akin to how doctors learn to associate signs and symptoms with the diagnosis of a new disease. This could help scientists generate more targeted hypotheses and drive a wide range of future research.
With these promising results, a lot of scientific work remains. Our dataset had many images labeled with smoking status, systolic blood pressure, age, gender and other variables, but it only had a few hundred examples of CV events. We look forward to developing and testing our algorithm on larger and more comprehensive datasets. To make this useful for patients, we will be seeking to understand the effects of interventions such as lifestyle changes or medications on our risk predictions and we will be generating new hypotheses and theories to test.
References
[1] Gulshan, V. et al. Development and Validation of a Deep Learning Algorithm for Detection of Diabetic Retinopathy in Retinal Fundus Photographs. JAMA 316, 2402–2410 (2016).
[2] Ting, D. S. W. et al. Development and Validation of a Deep Learning System for Diabetic Retinopathy and Related Eye Diseases Using Retinal Images From Multiethnic Populations With Diabetes. JAMA 318, 2211–2223 (2017).
[3] Esteva, A. et al. Dermatologist-level classification of skin cancer with deep neural networks. Nature (2017). doi:10.1038/nature21056
[4] Ehteshami Bejnordi, B. et al. Diagnostic Assessment of Deep Learning Algorithms for Detection of Lymph Node Metastases in Women With Breast Cancer. JAMA 318, 2199–2210 (2017).
Quick links
Other posts of interest
-
March 25, 2025
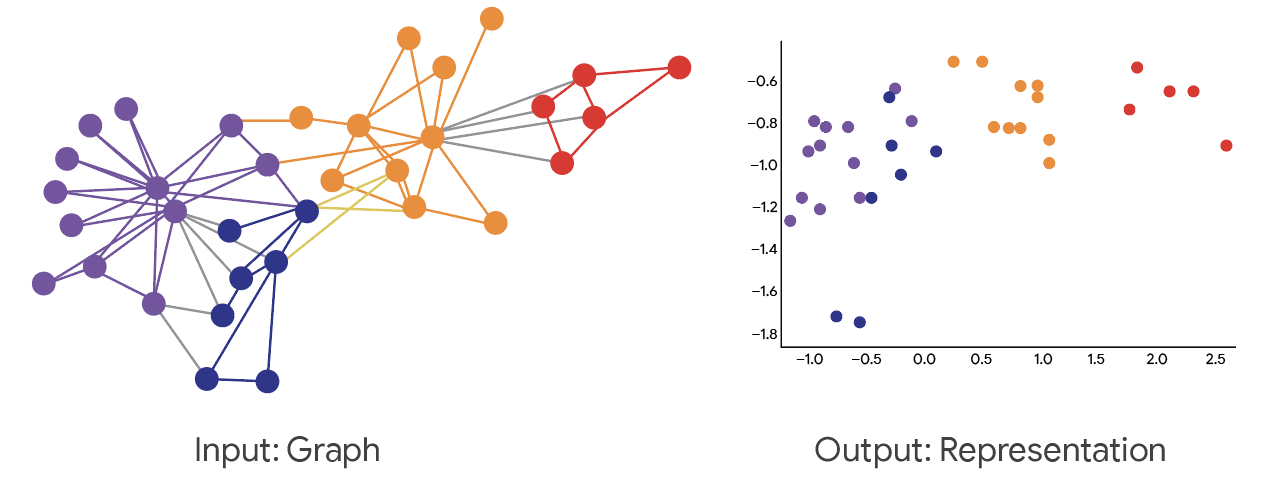
The evolution of graph learning- Algorithms & Theory ·
- Machine Intelligence
-
March 21, 2025
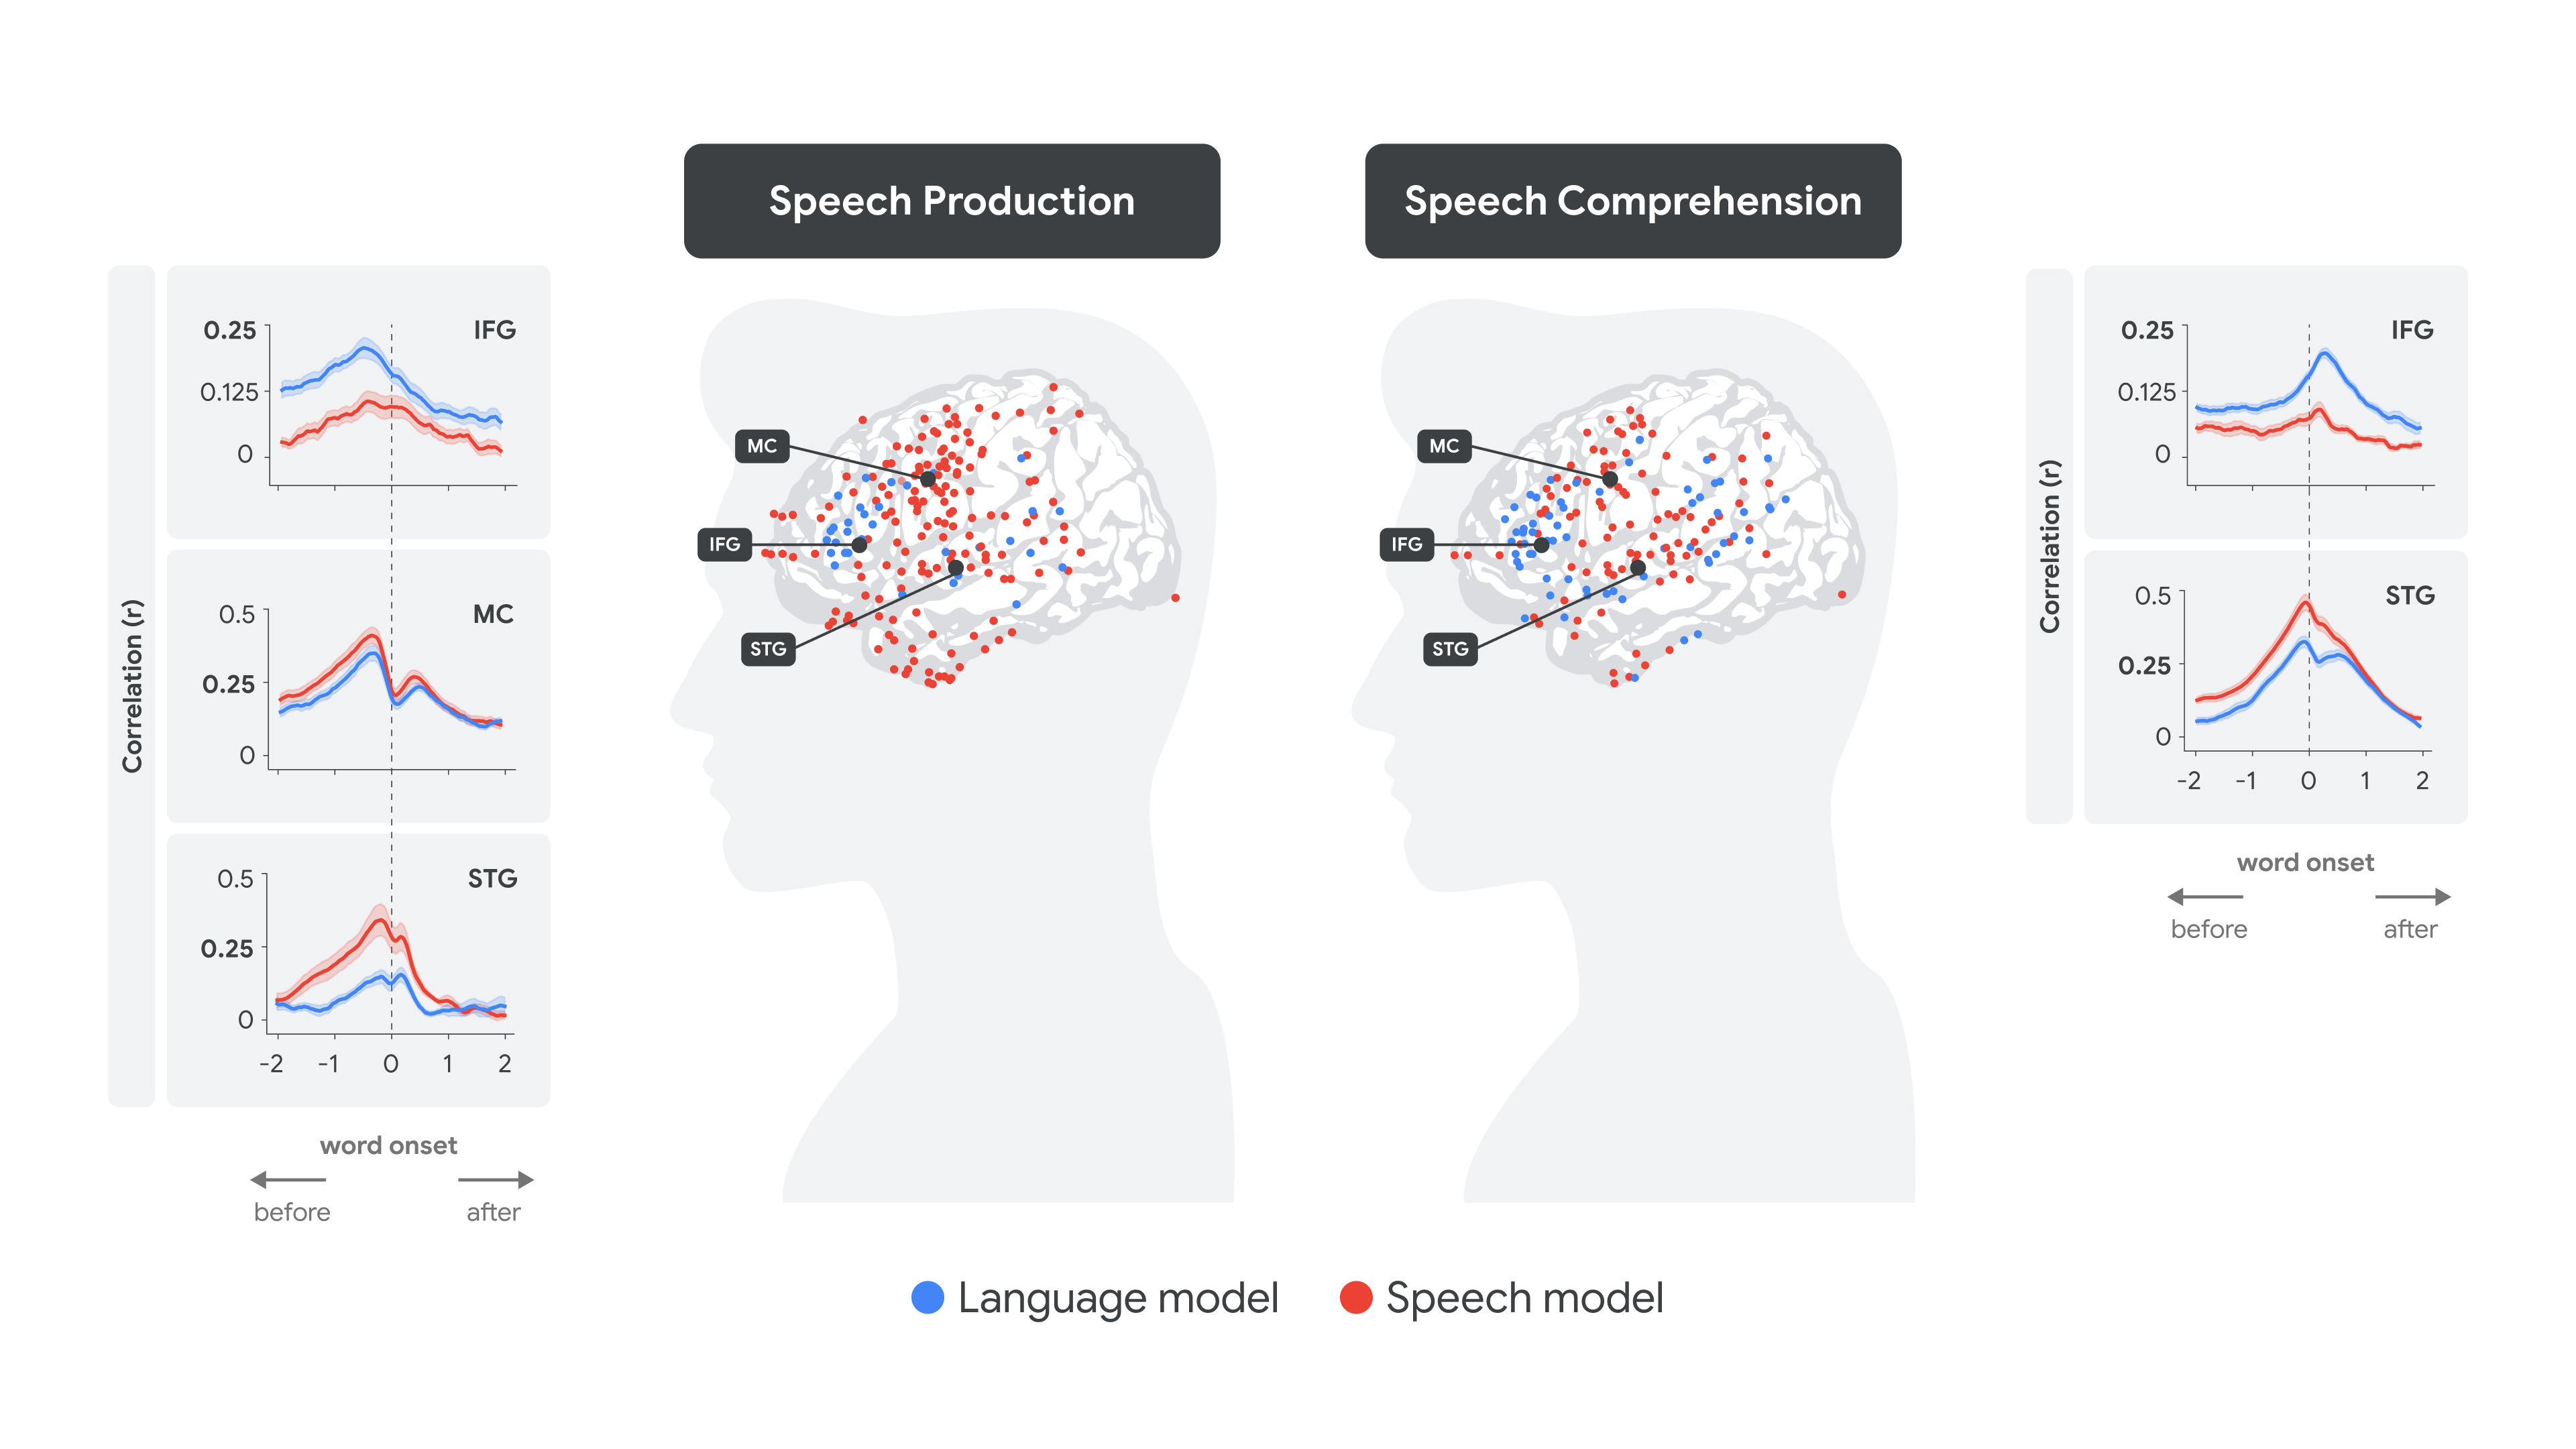
Deciphering language processing in the human brain through LLM representations- General Science ·
- Health & Bioscience ·
- Natural Language Processing ·
- Speech Processing
-
March 20, 2025
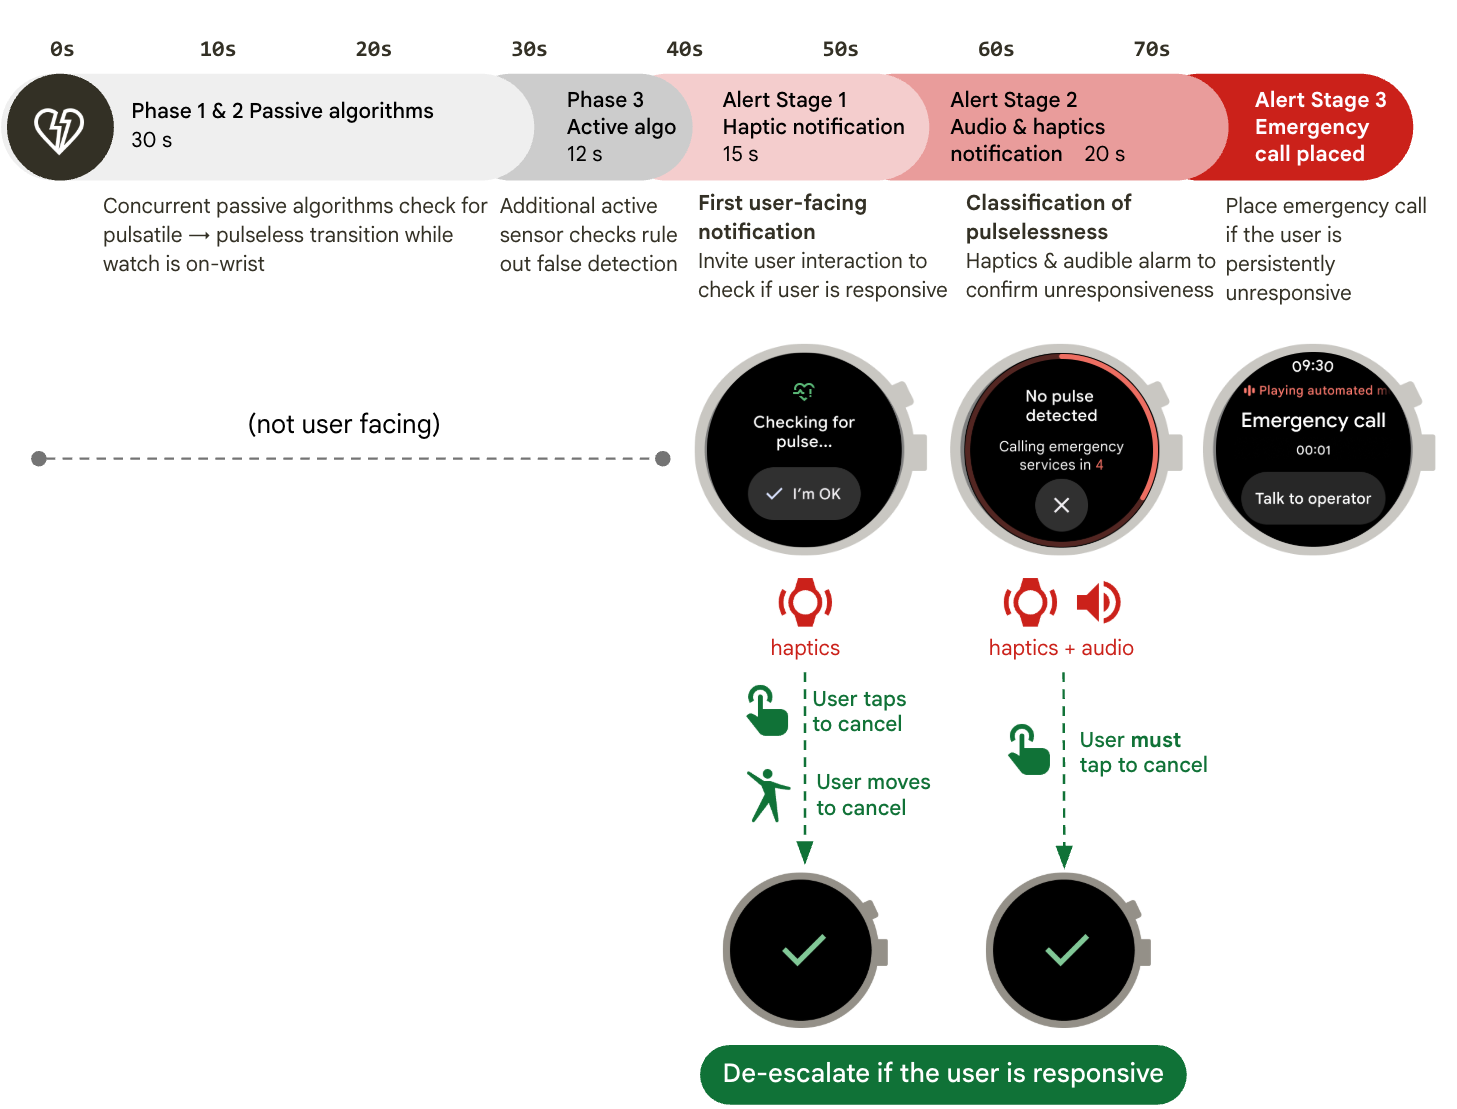
Loss of Pulse Detection on the Google Pixel Watch 3- Health & Bioscience ·
- Mobile Systems ·
- Product