Berkeley Earth Maps Powered by Google Maps Engine now available in the Google Maps Gallery
March 20, 2014
Posted by Dr. Robert Rohde, Berkeley Earth
Google Maps is a familiar and versatile tool for exploring the world, but adding new data on top of Google Maps has traditionally required expending effort for both data management and website scripting. Google recently expanded Google Maps Engine and debuted an updated Google Maps Gallery. These tools aim to make it easier for users and organizations to integrate their geographic data with Google Maps and share it with the world. At Berkeley Earth we had an early opportunity to work with these new tools.
The use of Google Maps Engine eliminates the need for users to run their own map-serving Web servers. Maps Engine also handles mundane mapping tasks, such as automatically converting georeferenced image files into beautiful map layers that can be viewed in Google Maps, no programming required.
Annual average land-surface temperature during the period 1951-1980 as estimated by Berkeley Earth.
Similarly, one can take tables of location data and map them onto a Google Map using geographic markers and popup message boxes that make it easy to explore georeferenced information.

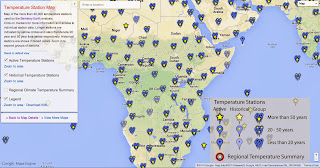
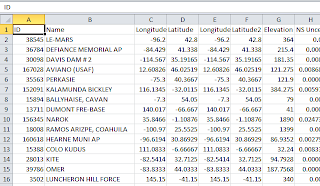
Map of the more than 40,000 temperature stations used by the Berkeley Earth analysis. On the left is part of the original table of data. On the right is its representation in Google Maps Engine.
When mapping locations, the new Maps Engine tools allows users to upload their own geographic markers or chose from Google’s many selections; the geographic marker icons used in the temperature station map above were uploaded by us. Alternatively, we could have used one of the stock icons provided by Maps Engine. In addition, users can customize the content and appearance of the popup message boxes by using HTML. If the georeferenced data can be linked the web addresses of already existing online content, one can also incorporate images or outgoing links within the message boxes, helping the user find more information about the content presented in the map.
The ease of putting image layers into the new Maps Engine has allowed Berkeley Earth to create and share many scalable maps of climate and weather information that are fun to explore. Incorporating these maps in our website and posting them on the Google Maps Gallery provides the public with a new tool to help locate local weather stations, learn about local climate, and download various kinds of weather and climate data.
Now, anyone can easily learn about both the weather in their city and the climate of the entire globe from a single, simple interface. Google Maps Engine and the new Maps Gallery has allowed us to bring the story of climate to a broad audience in a way that can be easily understood.
-
Labels:
- Product
Other posts of interest
-
February 21, 2024
Advances in private training for production on-device language models- Mobile Systems ·
- Product ·
- Responsible AI ·
- Security, Privacy and Abuse Prevention
-

February 6, 2024
Graph neural networks in TensorFlow- Algorithms & Theory ·
- Machine Intelligence ·
- Product
-
February 2, 2024
A decoder-only foundation model for time-series forecasting- Machine Intelligence ·
- Product